| How to design a
curve for your needs....
|
| |
In order to wrap your head around tonal
scale, you are going
to have to understand the tools that can be used to measure and modify
the way
a picture is recorded. Hopefully your monitor is close to correct
calibration
so you can see how the original image could possibly become a printed
image by
viewing it on a computer monitor. Often you see a gray strip on a web
page
which suggests that if you cannot see all the steps, you are not seeing
the
image properly. We will be using a computer generated gray strip to
show how
things work. Later we will use a Kodak Q-13 test target to show how
well your
camera captures the visible world. You should be able to see from C to
W in
distinct steps. If you can actually see from A to Z, so much the
better. If you
adjust your monitor or video driver to improve the image, do so now.
The small
strip in our examples has 26 boxes whose measured value starts at 255
and
descends by 10 steps to 5 on the black end. It goes left to right from
white to
black. The histograms and curves go from left to right from black to
white, so
don’t be confused by the direction. The Levels histogram in Photoshop
are the
way most people identify the tonal scale and adjust the end points and
the mid
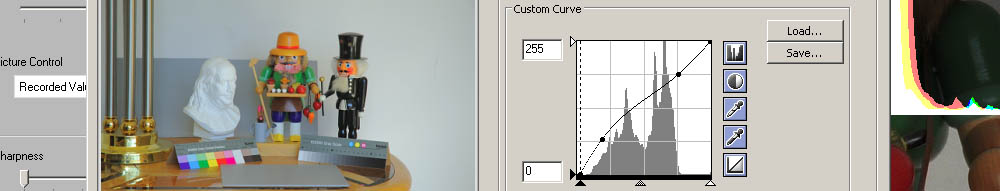
point. This particular example features a much
brighter mid point
for faces and improved ability to see detail in the dark areas. There
is a
sharper slope on both the high and low end to preserve detail where it
is
needed. Compare the original gray strip with the adjusted gray strip. You might want to use a curve like this to
take a picture of a bride in a white wedding dress with pearls and
fancy white stitching. I want to encourage you to create a still
life scene to assist you in creating the curve for your needs. I will
introduce you to the one I find very usefull. It is very patient,
always available and does not complain. The Ben Franklin coin bank
provides the high key detail. The farmer provides flesh tones, bright
saturated colors and spectral highlights. The magician provides dark
detail. The gray cards and Q-13 targets provide color and tone
standards. There are a variety of textures to judge focus. The scene
faces a South facing window with diffuse window covers and the whole
room is painted pure white for flash diffusion if needed. The following examples show how the Picture control curves behave. All pictures are made from the same NEF file and clipped from the Picture Control Utility.
All the variables in Picture Controls could
fill volumes and have many thousands of combinations, but you could
benefit by checking to see which settings would suit your needs best
and then proceed no farther.
After a few weeks of experimentation, I
discovered that some of the curves that were very usefull could be
duplicated in performance by simply applying the incremental digital
adjustments to the in camera settings. In a few situations, I found
that I could get the same result from in camera adjustment, or a custom
curve or Active D-Lighting. What are some of the ways we can use custom
Picture controls?
Let's explore the HDR problem to start with.
My experience is that shooting into a sunset is not that different in
tonal range than using a flash in a large room with a high ceiling.
Foreground images get burned out by the flash and people further away
get underexposed because of the geometric fall off of a single light
source. Lower contrast in the camera is part of the solution.
Preventing overexposed hot spots can be handled with a curve that has
less contrast in the bright area and more contrast in the shadow area.
I don't want to go into every problem area
that can be solved by Picture Control, so I will just show the opposite
situation to this which turns out to be what I call the classic red
flower problem. Nature plays tricks on photographers and creates colors
almost out of gamut and completely blindsides Nikon cameras whose
metering systems have minimal concern for the colors red, orange and
yellow. The failure is that the meter and simple histogram shows no
clipping but the detail in the red areas often are blown when it comes
time to process the image for web or print. In some cases shooting raw
doesn't prevent the problem. Wary photographers sometimes bracket
exposures on the underexposure end just to ensure that the problem will
not present itself. The problem is tricky because sometimes when there
are other flowers present, a pink or yellow flower will actually be the
highest in the red channel. The D90 has an RGB histogram and should
always be consulted before investing heavily in digital film and time.
One of the interesting aspects of looking for the blown channel is that
you can display the image and zoom in to the flowers and figure out
which one is blown. It will not blink on the blinky view. People have
wondered why you can zoom in greater than 100% on the D90 and I believe
it is precisely so you can isolate blown channel situations. As you
zoom in the histogram only reflects what is on the view screen and you
can watch the peak in the red channel move to the right until it hits
the edge. It is these times that you discover it is the pink blossom,
not the deep red one that is the problem. The more you can do to prevent color
clipping before the picture is taken the better you will succeed. The
red flower situation suggests lowering the exposure would help. I have
lowered the EV value by -1.5 EV for a particular Amerylus blossom with
great success. Lowering the contrast might have produced a similar
result as would lowering the gamma (brightness) using a custom curve.
There is not just one solution for this. One of the ways you could let
the camera help you is to use one of the automatic features of Picture
Controls. Instead of trying to guess about the degree of contrast to
use, consider using the Auto feature of contrast within the Picture
Control. My Experience has been that matrix metering can get within one
stop of the overal correct exposure and that when contrast is added
before the JPG process begins that the Auto feature will prevent
clipping and leave a small margin for error. This is an advantage over
using a custom curve with a white margin as seen in wedding dress
curves. Curves created in the Picture control utility are added to the
fundamental curve they are based on and so may translate maximum white
value to something less than 255 in the JPG. In real practice
overexposure will still show as overexposure, but to a lesser degree.
|
|
|||||||
|
Chapters: 1 History of curves and programmable contrast and gamma 2 Picture Control and Picture Control Utility 3 Creating and installing Custom curves in the camera 4 How to design a curve for your needs 6 D-Lighting applied after the shot 7 Where to go for more information © Leon Goodman 2009 |
|
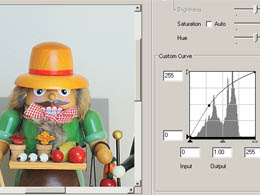
 The curves adjustment window
displays a histogram, but adjusts the
output by using a curve that represents the values being modified on
the
vertical axis. The composite picture below represents how the values
marked here
by a dot on the midpoint of the curve is translated from 125 to 155.
Curves
like this were used in the manufacture of film for almost 100 years.
The combination
of film/paper and developers, temperature and exposure had to be
predictable to
use the technology. This is called an “S”
The curves adjustment window
displays a histogram, but adjusts the
output by using a curve that represents the values being modified on
the
vertical axis. The composite picture below represents how the values
marked here
by a dot on the midpoint of the curve is translated from 125 to 155.
Curves
like this were used in the manufacture of film for almost 100 years.
The combination
of film/paper and developers, temperature and exposure had to be
predictable to
use the technology. This is called an “S” 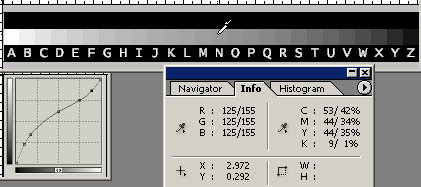 curve for obvious reasons.
Controlling
these variables contribute to consistency of the film and printing
industry.
curve for obvious reasons.
Controlling
these variables contribute to consistency of the film and printing
industry.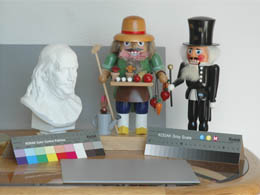
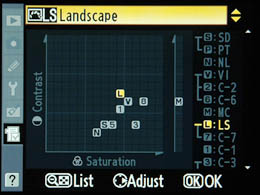 Let's start with the
basic set. Eliminate monochrome and we have five left. Close
examination
will reveal that there are only three curves and the others are
bumped versions of those curves. The map at the right shows
that Standard and Portrait are the same, differing only in sharpness,
and Normal is very close but has -1 contrast and saturation. Landscape
and Vivid are very close and differ by only one bump from each other in
contrast and saturation. The column of id's on the right side show
lines connecting variations with the primary Picture Control.
Let's start with the
basic set. Eliminate monochrome and we have five left. Close
examination
will reveal that there are only three curves and the others are
bumped versions of those curves. The map at the right shows
that Standard and Portrait are the same, differing only in sharpness,
and Normal is very close but has -1 contrast and saturation. Landscape
and Vivid are very close and differ by only one bump from each other in
contrast and saturation. The column of id's on the right side show
lines connecting variations with the primary Picture Control.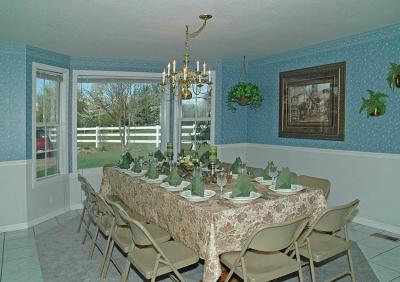 High Dynamic Range, HDR, is getting a lot of attention
and there are macros, plugins and special applications that require
multiple pictures from a tripod to accomplish. Consider the solutions
to a scene which includes a sunset (or sunrise) and other objects in
shadow areas.
High Dynamic Range, HDR, is getting a lot of attention
and there are macros, plugins and special applications that require
multiple pictures from a tripod to accomplish. Consider the solutions
to a scene which includes a sunset (or sunrise) and other objects in
shadow areas. 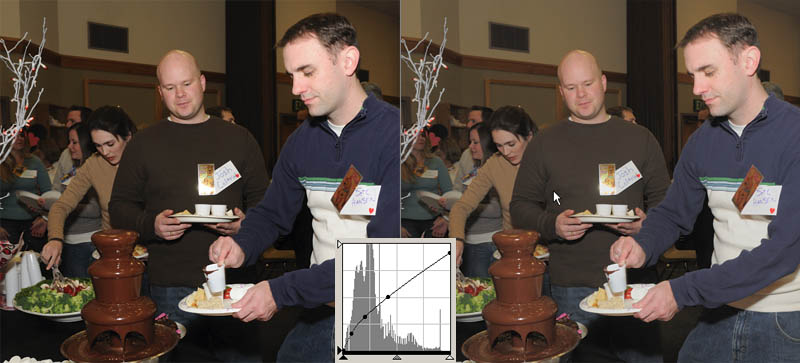
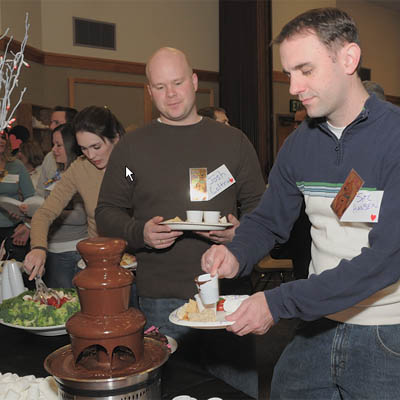 The left image is with
standard Picture Control and shows blasted face in foreground and
darker faces farther back. It is hard to see, but the texture is
blocked up in the sweater of the center person. The result of using the
curve looks like balancing the ambient light with the flash, but it is
not. It is the result of lowering contrast and bumping up the mid
range. A similar effect can be had by using Neutral at low contrast and
bumping the brightness up and bumping the saturation up by one. Either
one of those solutions would enhance the yield on wedding pictures of
brides in white and grooms in black in a light sucking hall such as
this one. The picture to the right was processed with the same "safe hi
- low boost" curve but using the D2XMode 1 Picture Control. The lessons
to be learned is that you do not have to be stuck with the "Look" of
any camera when you have control of all the parameters that make that
look and can apply them to any Nikon NEF file. I can't afford a D2 or
D3 or even a D300, but I can make my images look like the images those
cameras produce by using Picture Control.
The left image is with
standard Picture Control and shows blasted face in foreground and
darker faces farther back. It is hard to see, but the texture is
blocked up in the sweater of the center person. The result of using the
curve looks like balancing the ambient light with the flash, but it is
not. It is the result of lowering contrast and bumping up the mid
range. A similar effect can be had by using Neutral at low contrast and
bumping the brightness up and bumping the saturation up by one. Either
one of those solutions would enhance the yield on wedding pictures of
brides in white and grooms in black in a light sucking hall such as
this one. The picture to the right was processed with the same "safe hi
- low boost" curve but using the D2XMode 1 Picture Control. The lessons
to be learned is that you do not have to be stuck with the "Look" of
any camera when you have control of all the parameters that make that
look and can apply them to any Nikon NEF file. I can't afford a D2 or
D3 or even a D300, but I can make my images look like the images those
cameras produce by using Picture Control.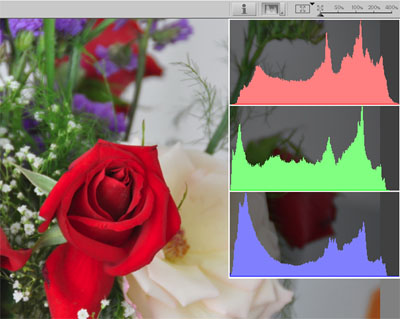 After working up a
number of solutions to the red rose problem, I found that I could use
standard curves with adustments to contrast and brightness and could
insure success by using Auto Contrast, but one solution allowed me to
absolutely nail the exposure and contrast and brightness. It turned out
to be Automatic Active D-Lighting, as seen in the picture to the right.
Notice that there is no clipping in the color histograms either on the
light or dark end of the curves. No matter what you do with the middle
values in post processing, no data was lost and maximum use of the
exposure data filled the chart. The next chapter will explain how to
use Active D-Lighting.
After working up a
number of solutions to the red rose problem, I found that I could use
standard curves with adustments to contrast and brightness and could
insure success by using Auto Contrast, but one solution allowed me to
absolutely nail the exposure and contrast and brightness. It turned out
to be Automatic Active D-Lighting, as seen in the picture to the right.
Notice that there is no clipping in the color histograms either on the
light or dark end of the curves. No matter what you do with the middle
values in post processing, no data was lost and maximum use of the
exposure data filled the chart. The next chapter will explain how to
use Active D-Lighting.